
 Europe
 Austria
 Belgium
 Bulgaria
 Croatia
 Czech Republic
 Denmark
 Estonia
 Finland
 France
 Germany
 Greece
 Hungary
 Ireland
 Italy
Italy Latvia
 Lithuania
 Luxembourg
 Malta
Malta Netherlands
 Norway
 Poland
 Portugal
 Romania
 Slovakia
 Slovenia
 Spain
Spain SwedenEurope
Introduction
What you will find in this dasboard
This dashboard presents an overview of the LAMASUS scenarios. It presents draft results of the comprehensive analysis that was performed over the last year. The dashboard is intended to support a structured dialogue.
The purpose is twofold:
- To describe the first implementation of the LAMASUS scenarios.
- To provide insight into the quantitative results of the LAMASUS scenarios.
You will find three sections:
- A description of the narrative and goals of the Baseline scenario and of the two LAMASUS policy scenarios: Full Productivity and Environmental Ambitions.
- An overview of which policies are included in the two policy scenarios.
- An interactive presentation of scenario results.
We greatly appreciate it if you find a moment to review this information in advance.
Comments
Loading comments...
The LAMASUS scenarios
Goals of the scenarios
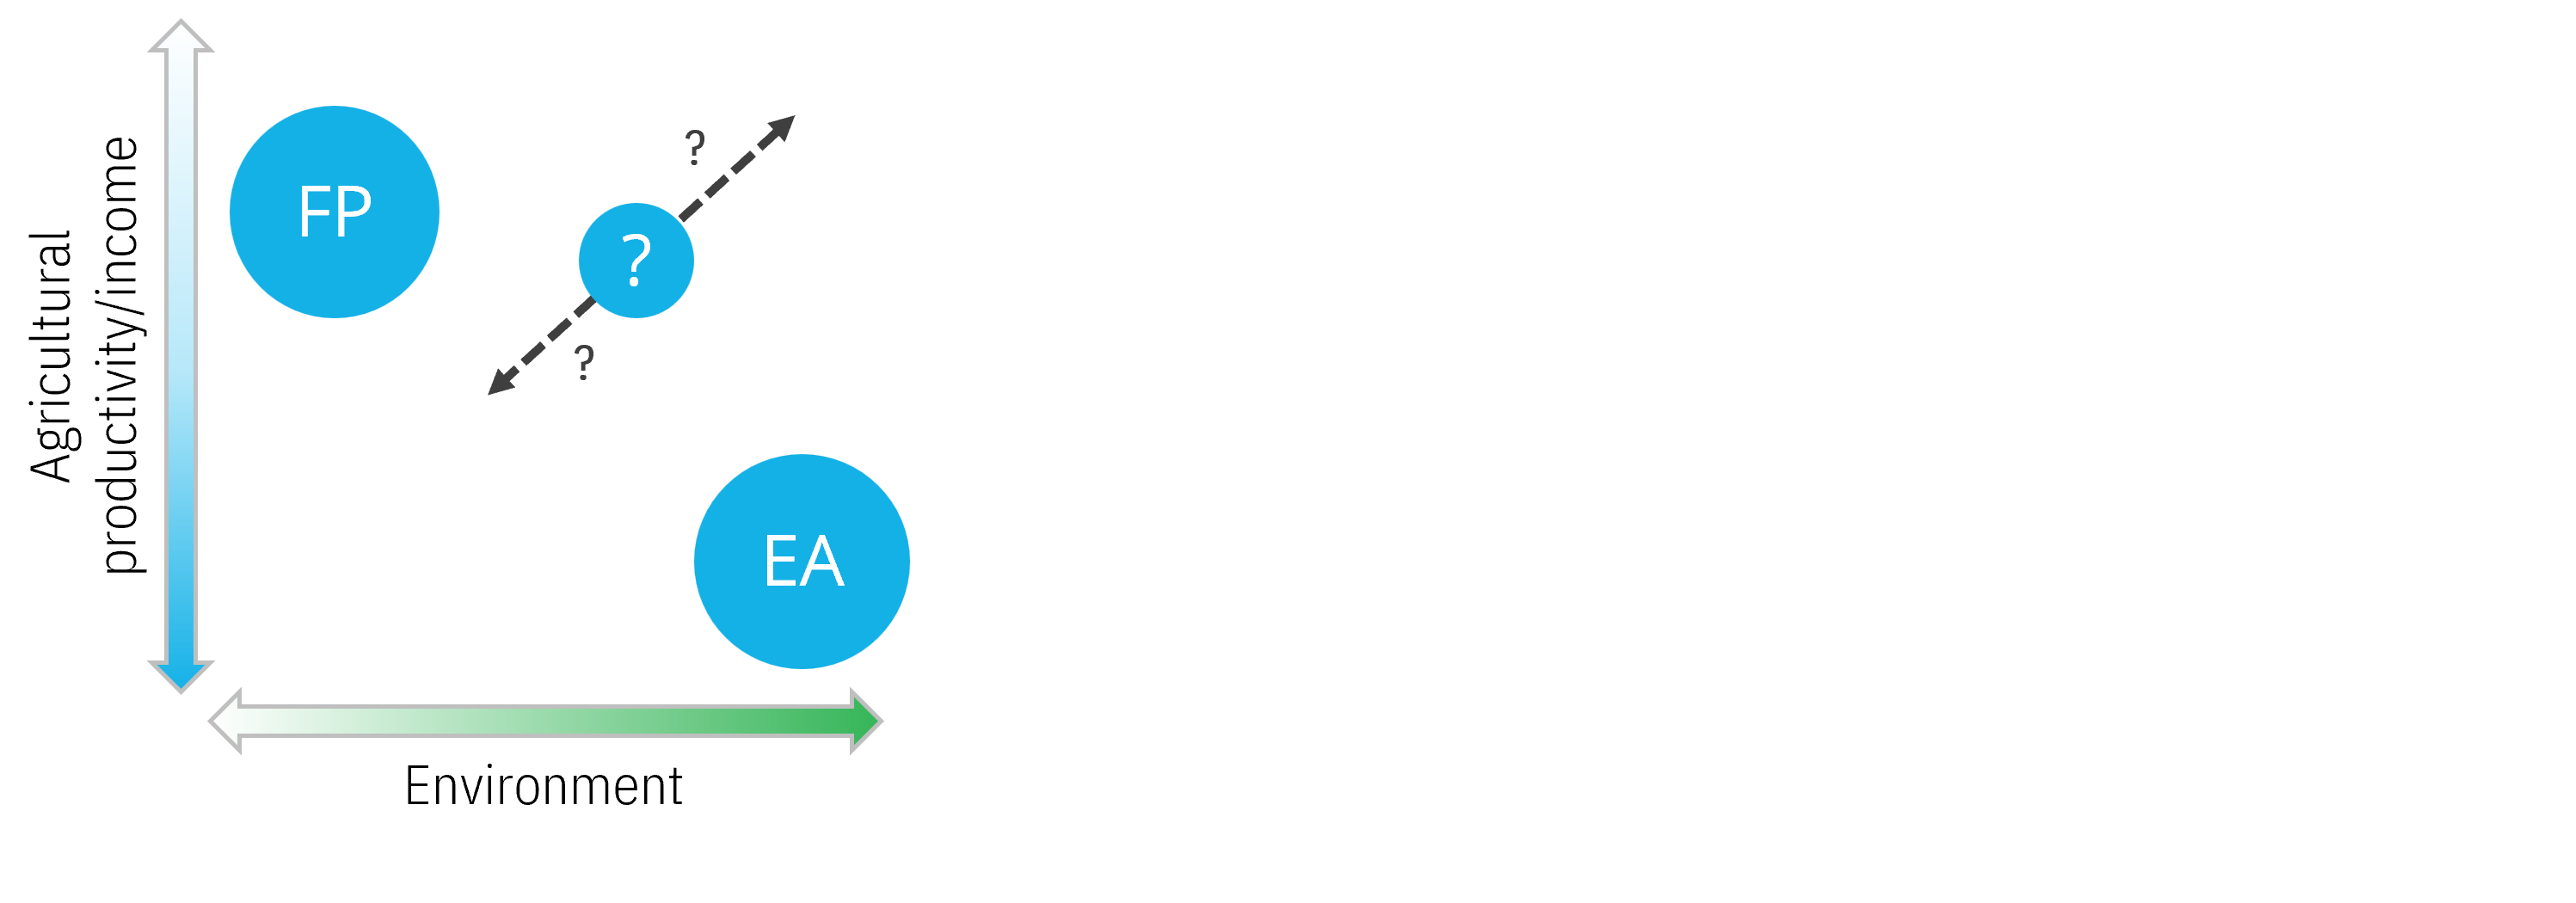
Figure 1 An illustration of the scenarios: Full Productivity (FP) and Environmental Ambitions (EA).
The LAMASUS team developed a set of forward-looking scenarios that explore the future of the European agricultural and forestry sectors and the environment up to the year 2050. The LAMASUS scenarios explore different approaches to balancing environmental goals, economic viability, and food security in European agriculture. These scenarios are built on existing, legally binding European policies. Specifically, all scenarios aim to achieve the following targets, although it depends on the scenario whether the goals are met:
- The legally binding target of capturing 310 million tonnes of CO2 through Land Use, Land-Use Change, and Forestry sectors.
- The measures to support the implementation of the Nature Restoration Law, which aims to restore ecosystems across the EU.
- A non-increasing CAP budget, recognising that additional funding for eco-schemes or compensation for environmental constraints would require reducing other parts of the CAP, e.g. reducing standard direct payments.
While these targets are essential for tackling climate change and protecting biodiversity, achieving them requires careful land management. Land is a limited resource, and decisions in one area likely create trade-offs elsewhere.
For example, large-scale afforestation (planting large areas of trees) would help capture more CO2. However, if afforestation reduces the land available for farming, it could lead to more intensive agricultural practices on remaining farmland, increasing pressure on biodiversity and conflicting with other goals of the European Green Deal.
Similarly, extensive farming practices -such as using fewer chemical inputs and allowing for more natural habitats on farmland- can protect ecosystems but may reduce yields. This could increase the demand for farmland, expanding crop and pasture areas in other locations, either within or outside of the EU.
The central question we explore is: Which policy pathways are compatible with Europe’s agricultural competitiveness and food security, as well as ambitious environmental goals for climate and biodiversity?
More specifically, for each of the pathways we assess the following:
- Are EU LULUCF goals achieved, in line with the Climate Law?
- Is biodiversity set on a path to recovery in line with the Biodiversity Strategy?
- How are incomes of farmers affected?
- What is the impact on the EU’s ability to produce enough food to ensure food security and sovereignty?
- What is the impact of different policies on environmental and socio-economic goals and how do the policies interact?
To answer these questions, we consider three scenarios: one Baseline Scenario, in which no major new policy initiatives beyond those already legislated are assumed. And two policy scenarios that both aim to capture 310 million tonnes of CO₂ by 2030 and to implement the Nature Restoration Regulation, together with a non-increasing CAP budget. However, they give a different emphasis on social, economic, and environmental goals:
- Full Productivity (FP) prioritizes high agricultural output and incomes. CAP payments are redirected to productivity categories. The scenario relies on bioeconomy, biochar and forest expansion for carbon sequestration, and follows a minimalistic interpretation of the NRR. This minimizes changes to farming but offers fewer climate and biodiversity benefits.
- Environmental Ambitions (EA) maximizes carbon sequestration and biodiversity. CAP payments are redirected to environmental categories. focusing on extensification in agriculture and forestry, peatland rewetting, and reduced inputs. This ensures strong climate action and biodiversity gains but lowers agricultural productivity.
Full Productivity – Prioritizing food security, agricultural incomes, and the bioeconomy

In the Full Productivity (FP) Scenario, the primary focus is to maintain agricultural income and food security within the EU. This approach prioritises agricultural output, which may compromise biodiversity and broader environmental goals. The strategy for achieving the EU’s carbon sequestration target of 310 million tons of CO₂ by 2030 relies more on efficient forest management and technology-driven solutions to minimise the impact on productive agricultural land. Countries do comply with the NRR, but in a minimalistic way.
- The CAP strategy includes a strong shift of 80% payments towards productivity-oriented categories such as INVEST, KNOW, and RISK. These investments result in relatively higher yields compared to baseline levels.
- The forestry sector is to become more efficient by expanding intensively managed forests that allow for a growing bioeconomy to mitigate GHG emissions.
- A major effort is made to enhance the application of biochar in agricultural fields, which simultaneously sequesters carbon and also benefits crop yields.
- The NRR is respected in a minimalistic way: peatlands are rewetted up to 1/3 of 50% in 2050, 10% of forests are designated as set-aside and 20% to closer-to-nature management, and landscapes with woody features expand up to 14% by 2050.
- Biodiversity strategic plans are implemented by prohibiting the use of highly hazardous pesticides, by regulating nitrogen surpluses in hotspot regions, and by a modest expansion of organic farming up to 17% in 2050.
Environmental Ambitions – Maximizing carbon sequestration and biodiversity

In the Environmental Ambitions (EA) Scenario, the EU goes beyond the NRR in terms of its biodiversity targets, in addition to meeting the targets of climate sequestration. Moreover, Green Deal targets connected to fertiliser and pesticide reduction, as well as the organic farming targets, will be fully met by 2030. Unlike productivity-driven approaches, this scenario includes more de-intensification of agriculture and dedicates more area to ecological restoration. This shift towards extensive, nature-based farming is expected to lower agricultural productivity and incomes, while significantly reducing emissions and restoring ecosystems.
The following additional assumptions were made:
- The CAP strategy in the FP scenario includes a strong shift of payments towards climate and environment-oriented categories such as eco-schemes, ENVCLIM and ANC, thereby supporting large-scale shifts to more sustainable farming practices.
- The forestry sector is assumed not to intensify ensuring carbon stocks in forests are maintained or enhanced to achieve the LULUCF goals.
- Trade regulations are introduced to prevent leakage effects of forestry to non-European countries.
- Reduced tillage on agricultural lands, expansion of trees in grazing land (silvopastures), and a strong expansion of landscape features are introduced to further enhance carbon capture.
- Rewetting of peatlands with up to 50% restored by 2050 is a major contributor to the LULUCF goals.
- An ambitious interpretation of the biodiversity strategy is implemented, which assumes the following: expanding organic farming to 26% in 2050, prohibiting hazardous pesticides, decreasing overall pesticide application by 50%, and reducing nitrogen pollution for both hotspot and overall fertilizer and manure application.
Overview: Policy representation in scenarios
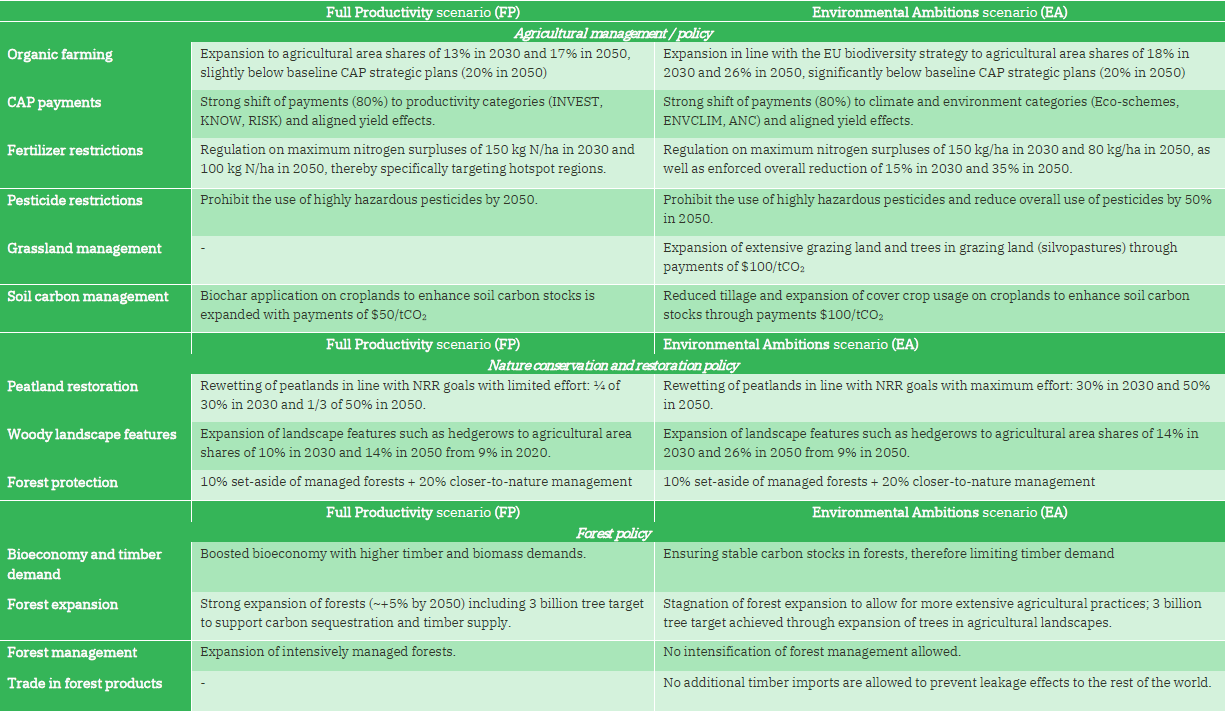
Table 1: Overview of the policy assumptions for the two LAMASUS policy scenarios.
Table 1 summarises how key policies are implemented across the three scenarios, showing the different approaches to achieving 310 million tons CO₂ sequestration by 2030, and restoring ecosystems across the EU, with varying results on food security, farmer and forest owner incomes, and biodiversity outcomes.
Comments
Loading comments...
Scenario results
Digging into quantitative model results
The LAMASUS scenarios are implemented in 5 EU-wide models from the LAMASUS toolbox: GLOBIOM (IIASA-AUT), CAPRI (EuroCare-DE), MAGNET (WUR-NL), IMAGE (PBL-NL), CluMondo (VU-NL). Together they represent a range of scales, from the global level to EU, member state and NUTS2 level all the way down to the landscape level (1x1 km).
While all models represent land use and management in Europe, they also have particular strengths: not all policy measures can be implemented in all models, which makes it useful to focus on particular model results for particular scenario questions. In addition, a multi-model assessment gives more robust insights as one model may respond differently to policy measures than another model.
In short, the models can be described as follows:
- MAGNET: global macro-economic model, full economy covered but in an aggregated way - 1st choice: for trade analysis
- GLOBIOM: global economic land use model, focus on agriculture, forestry and land management - 1st choice for LULUCF estimates
- CAPRI: European economic agricultural model, detailed agriculture at NUTS2 level and CAP - 1st choice for CAP, nutrient and pesticide dynamics
- IMAGE: global integrated assessment model, interactions of agriculture, climate and biodiversity, coupled to MAGNET - 1st choice for biodiversity indicators
- CLUMondo: high-resolution land system model - 1st choice for local land-use change
The following sections describe the results using interactive figures displaying how various indicators develop in the three LAMASUS scenarios. You can gain insights into the different outputs, by choosing:
- Model
- Breakouts, e.g. item (total crops or individual items, dairy timber, etc.)
- Regions
- Agricultural and forestry commodities
Please note, if:
- Changes are difficult to see toggle 'Y axis auto scale' to improve visibility of changes in results.
- A figure remains blank if results are not available for that particular breakdown.
Comments
Loading comments...
Climate and biodiversity goals
LULUCF carbon dioxide emissions
Figure 2: carbon dioxide emissions from land use, land-use change and forestry (LULUCF). An increase in the carbon sink of LULUCF is needed to achieve the legally-binding LULUCF target.
CO2 emissions from land use, land-use change and forestry (LULUCF) are an important source of greenhouse gas emissions. In addition, the EU climate law prescribes a specific goal of -310 MtCO2 captured through LULUCF by 2030. Net emissions in 2023 were reported at-198 MtCO2 per year by the EEA. The GLOBIOM model results show that the Environmental Ambitions scenario project a strong increase in the carbon sink down to -345 MtCO2, which matches the LULUCF goal. The Full Productivity scenario does not reach the target.
Greenhouse gas emissions
Figure 3: greenhouse emissions from the Agricultural and Forestry sectors. These include carbon dioxide emissions from e.g. forest harvests or peatland degradation as well as non-CO2 emissions from agricultural activities such as nitrous oxide from fertilizer use or methane emissions from cattle rearing.
Total greenhouse gas emissions include both carbon dioxide emissions from e.g. forest harvests or peatland degradation as well as non-CO2 emissions from agricultural activities such as nitrous oxide from fertilizer use or methane emissions from cattle rearing. Total emissions decreased modestly in the Baseline scenario. The measures in the Full Productivity scenario reduce the emissions slightly more, and the Environmental Ambitions scenario even further.
Biodiversity loss
The EU biodiversity strategy aims to reverse the EU-wide decline in biodiversity.
Please review the results in the Y-axis autoscale: A 1 percentage point increase is a substantial improvement in biodiversity.
The BII indicator mainly reflects changes in land use. It already shows improvements in the Baseline scenario resulting from a general reduction in agricultural land use. The BII further increases in the Environmental Ambitions scenario. The Full Productivity scenario causes a modest decline.
Biodiversity-friendly practices
Figure 5: the biodiversity friendly farming practices index
The biodiversity-friendly farming practices index takes into account farming intensity and pollution. It represents changes that are relevant for biodiversity in agricultural landscapes which is in turn relevant for farm-birds and butterflies, species that are central in the EU biodiversity strategy and the NRR.
Fertilizer use
Figure 6: total synthetic fertilizer and manure use in agriculture
Fertilizer and manure application on agricultural fields are the main drivers of nutrient pollution. A decrease in fertilizer use indicates reduced pressure on the environment from excessive nutrients.
Nitrogen pollution
Figure 7: the nitrogen balance in agriculture
The nitrogen balance is the difference between inputs such as fertilizer, manure and nitrogen deposition, and how much nitrogen is taken up by plants. The higher the balance, the higher the nitrogen surplus which is then emitted to the environment, for example to surface waters leading to reduced water quality and negative effects on biodiversity.
Pesticide use
Figure 8: pesticide use per major agricultural commodity.
A reduction in pesticide use is one of the goals of the Farm-to-Fork strategy. The baseline already shows a continued decrease in pesticide use. Especially in the EA scenario a strong decline is shown as a result of policy measures.
Comments
Loading comments...
Economic viability and food security
Farm-income effects
Fig 9: value-added indicator
The value-added indicator combines the total production value, costs and subsidies to estimate the income of farmers. Overall, a $4 billion annual reduction is projected by GLOBIOm in the Environmental Ambitions scenario compared to Baseline and Full Productivity by 2050. This is roughly similar to 7% of the AP budget or €350 per farm (assuming current nr of farms).
Trade developments
Figure 10: changes in net trade for major countries inside and outside Europe for selected commodities. Negative values mean a country or region is a net importer while positive values mean a net exporter.
Net trade indicates whether a country imports (negative) or exports (positive) more in terms of agricultural commodity volume. Currently, the EU is still a net importer, although this is projected to further decrease getting closer to zero in the baseline scenario. The policy measures in the FP scenario cause this development to stagnate with the trade balance more less stable at EU level. In the EU scenario, this trend is reversed with net trade going further negative showing increased dependency on agricultural imports.
Commodity prices in agriculture and forestry
Figure 11: producer prices of agricultural and forestry commodities
Prices at farm gate are projected to change substantially, although the models project different trends: Increasing prices in MAGNET, stable prices in CAPRI, and decreasing prices in GLOBIOM. The policies in Environmental Ambitions generally lead to higher prices, although not by more than 10% on the EU level.
Producer prices differ across CAPRI, GLOBIOM, and MAGNET because each model uses its own database year, product aggregation and calibration approach. Even for 2020, values may not match exactly, as models are calibrated representations of the economy rather than reproductions of a single observed price series.
Food availability
Fig 12: food availability for different commodities per capita per day
Food availability is a key indicator for food security, reflecting how much food is available to be bought per person in terms of kilocalories per day. The results of our analysis shows that food availability is only marginally affected, reflecting the limited effects of changes in the agricultural sector on consumption to the strong purchasing-power of the European population. At the country-level things may be different.
Comments
Loading comments...
Developments in agriculture and forestry
Agricultural production
Figure 13: production of agricultural and forestry commodities
Production of crops, livestock products and timber is at the core of the LAMASUS scenarios. In the baseline scenario, agricultural production shows modest increases or decreases dependent on the commodity and model.
In the Environmental Ambitions scenario, production is generally lower than in the baseline reflecting a focus on more nature-friendly farming practices and expansion of nature restoration areas on former agricultural land thereby limiting production.
In the Full Productivity scenario, production increases relative to the baseline in all models. CAP investments in productivity, a larger bioeconomy and limited restraints for nature restoration and biodiversity result in higher productivity, although model parameterizations lead to different overall results.
Timber production
Fig 14: forestry production in terms of m3/yr
A strong increase in timer production is projected in the Full Productivity scenario, reflecting a focus on the bioeconomy. In the Environmental Ambitions scenario on the other hand, timber use stagnates to allow for more extensive forestry wit higher carbon storage and more nature value.
Crop yields
Figure 15: crop yields
The average efficiency of crop yields and the forestry sector determines how much land is needed to produce commodities.
- The Baseline scenario shows a modest continued increase for most cases.
- The Environmental Ambitions scenario shows a limited increase or a modest decrease compared to the baseline in line with the scenario narrative.
- The Full Productivity scenario shows an increase relative to the baseline in CAPRI and GLOBIOM, and a decrease in MAGNET and IMAGE, reflecting different model parameterizations.
Area in use for crop, livestock and forestry production
Figure 16: area in use for crop and livetsock production and total forest area
The scenarios show different impacts on land area in use for cropland, grazing land and forestry. Overall agricultural land is fairly stable in Baseline and Full Productivity in all models, except for GLOBIOM that shows a substantial decline. The Environmental Ambitions scenario shows a strong decline in agricultural land in all models.
Land-use change by member state
Figure 17: member state-level percentage (%) changes from 2020 to 2050 for cropland, grazing land, total agricultural land and forests
Digging into the country-level shows major differences between countries.
Comments
Loading comments...
Unpacking the effects of policy measures
Policy effects on agricultural developments - MAGNET
Figure 18: Unpacking the contributions of different policy levers to scenario developments for crop production, harvested area, yields and GHG emissions for the EU in 2050 for the MAGNET model.
Using decomposition model runs, we calculate the effect of each separate policy measure on the model results for key indicators. The policy measures included in the figure indicate the number of levers that have been included in the model parameterization of MAGNET.
Policy effects on agricultural developments - CAPRI
Figure 19: Unpacking the contributions of different policy levers to scenario developments for crop production, harvested area, yields and GHG emissions for the EU in 2050 for the CAPRI model.
Using decomposition model runs, we calculate the effect of each separate policy measure on the model results for key indicators.
Policy effects on agricultural developments - GLOBIOM
Figure 20: Unpacking the contributions of different policy levers to scenario developments for crop production, harvested area, yields and GHG emissions for the EU in 2050 for the GLOBIOM model.
Using decomposition model runs we calculate the effect of each separate policy measure on the model results for key indicators.
Policy effects on agricultural developments - IMAGE
Figure 21: Unpacking the contributions of different policy levers to scenario developments for crop production, harvested area, yields and GHG emissions for the EU in 2050 for the IMAGE model.
Using decomposition model runs, we calculate the effect of each separate policy measure on the model results for key indicators.
Comments
Loading comments...
To the landscape level
High-resolution assessment of land system changes
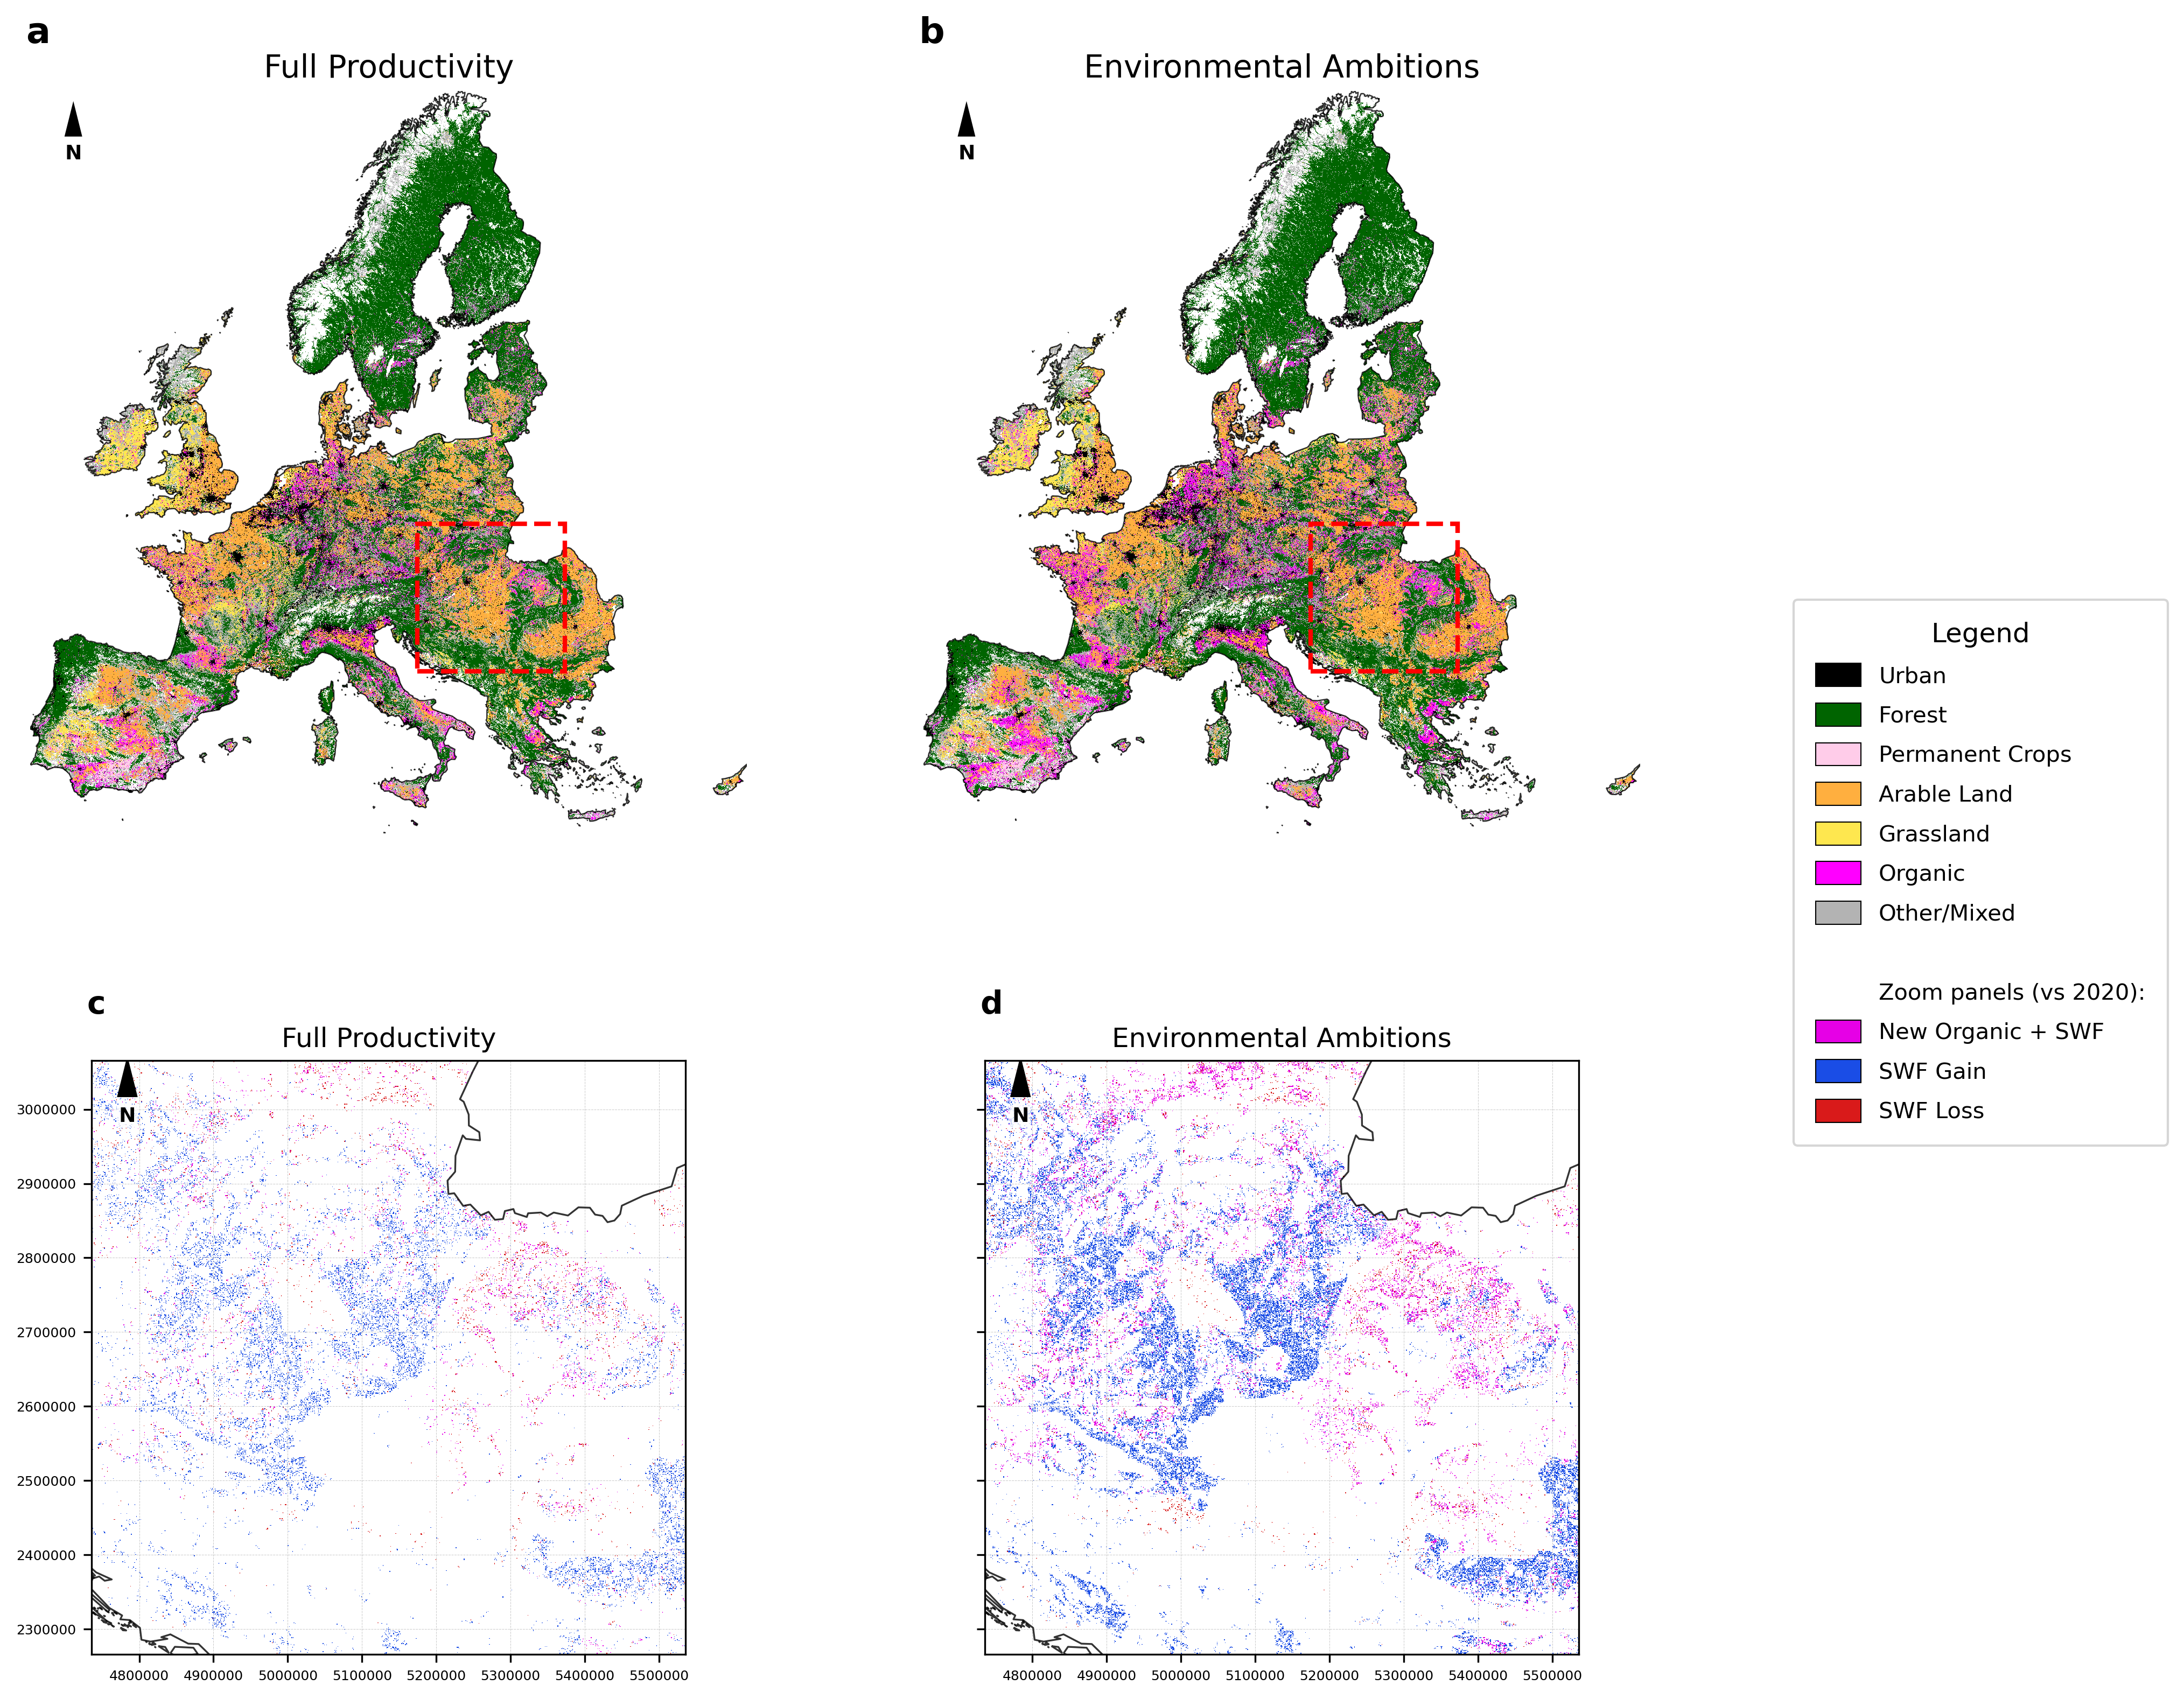
Figure 22: Land system changes (1x1 km) in the Full Productivity and Environmental Ambitions scenarios with a zoom of changes in organic farming and small-woody features (SWF) expansion in Southeastern Europe.
The high-resolution (1x1 km) projections of the CluMondo model provide insight in change in landscape level effects of policy measures, in this case organic farming and expansion of landscape elements such as hedgerows. In line with scenario assumptions, Full Productivity show modest increases while Environmental Ambitions shows strong increases.
Changes in land-use management
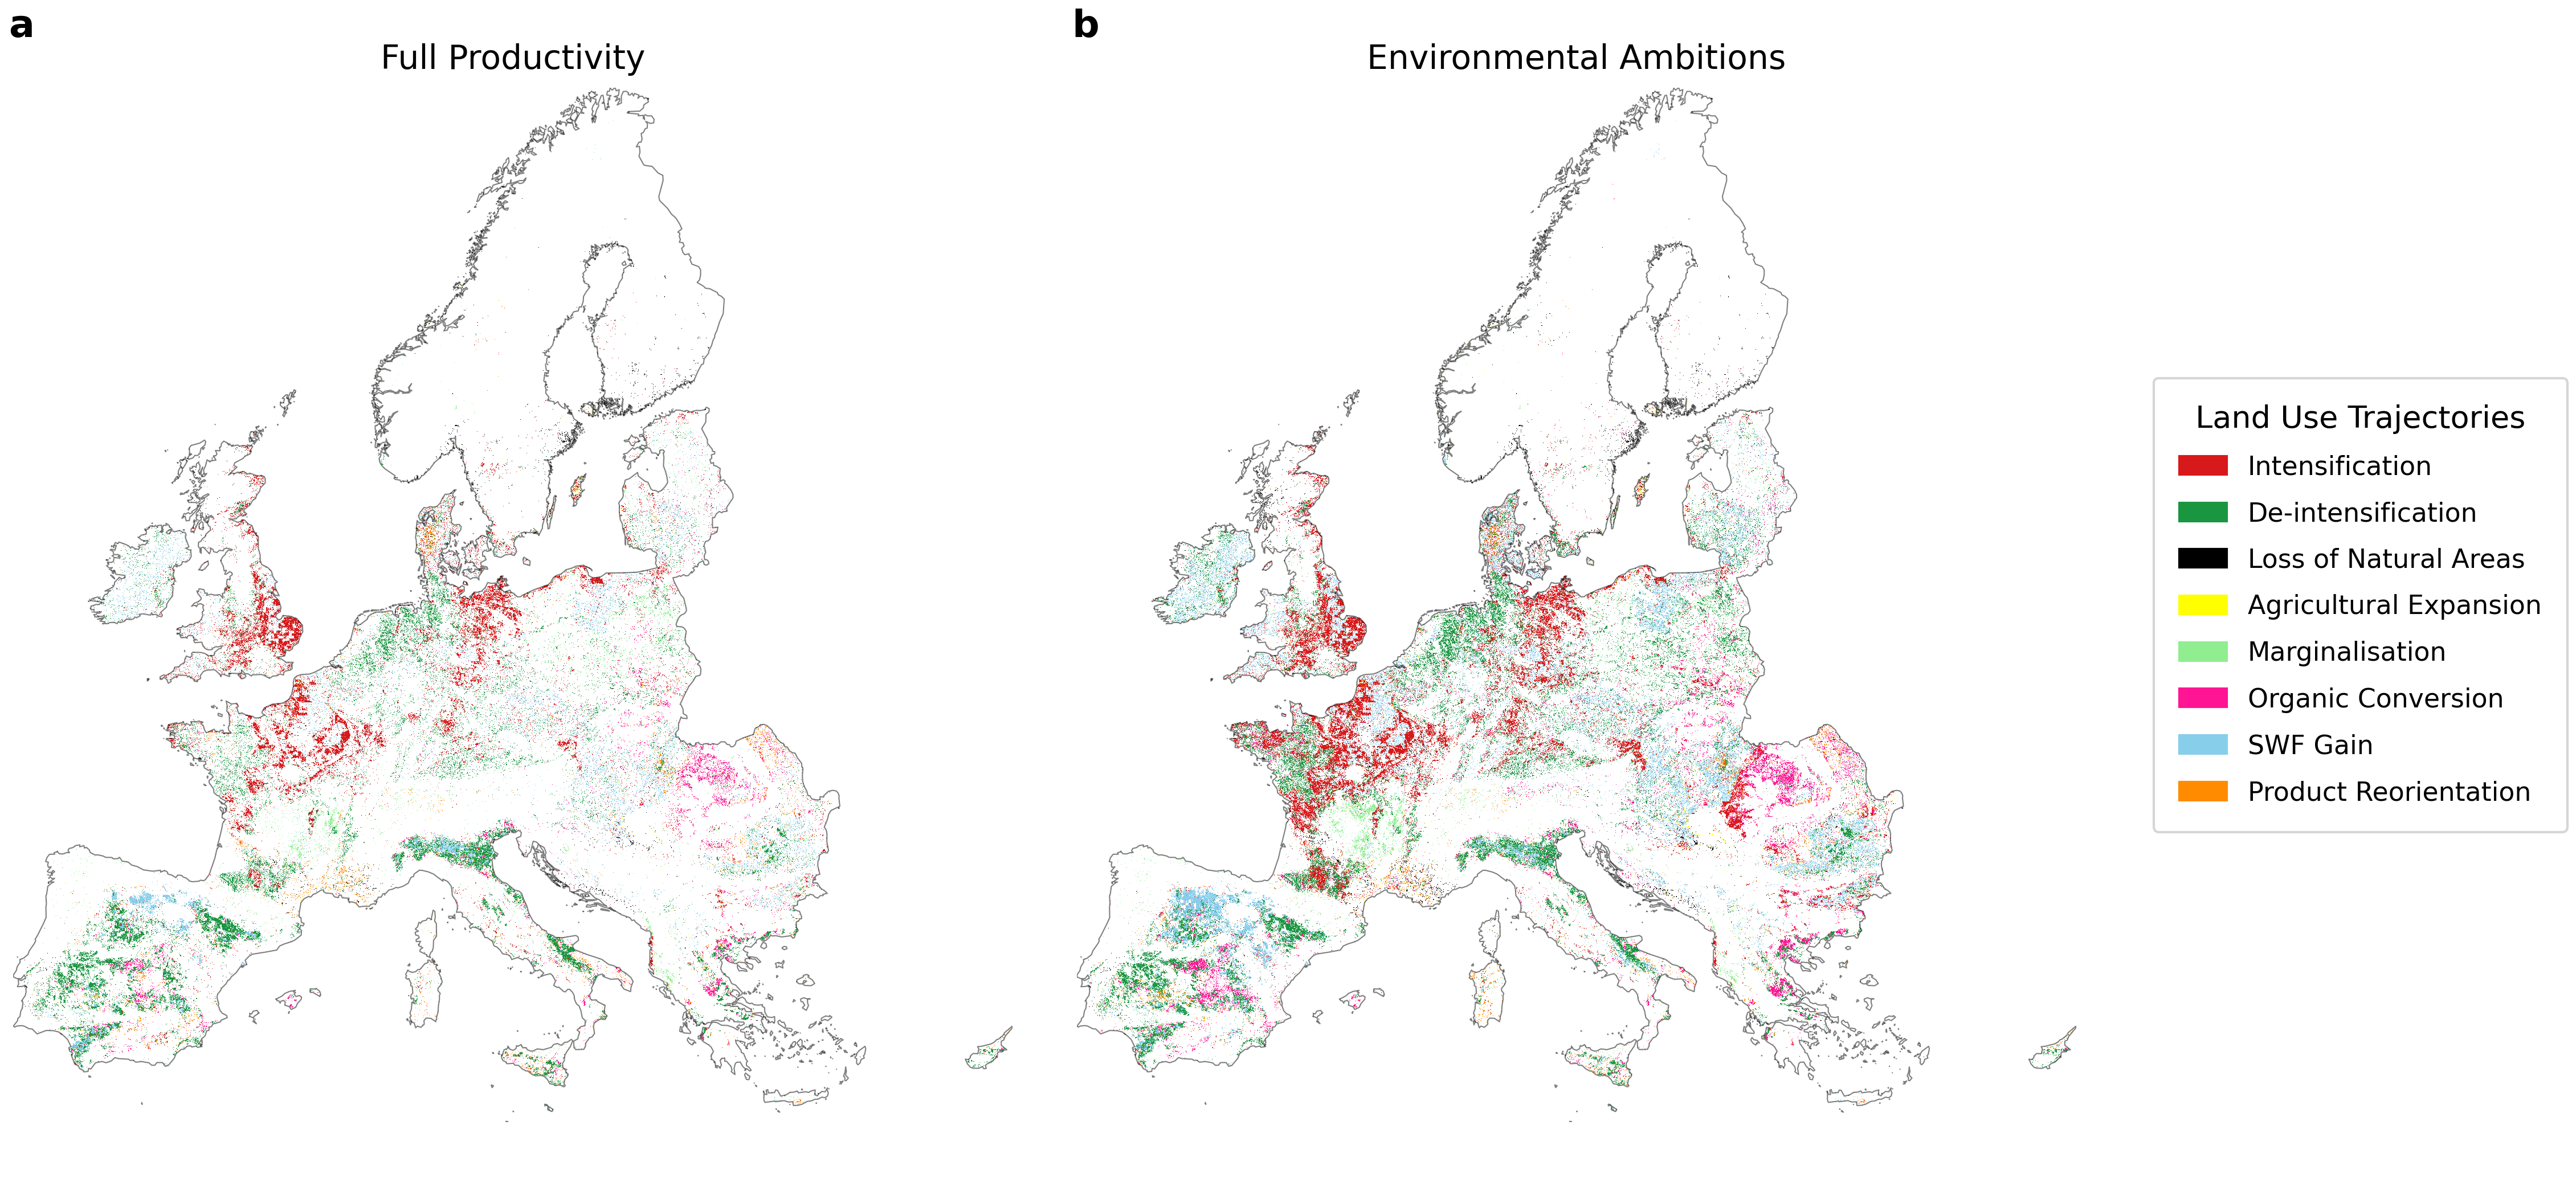
Figure 23: Changes in land management in the FP and EA scenarios in the high-resolution assessment using CluMondo.
The policy measures lead to spatial redistribution of land systems resulting in (continued) intensification in some regions and extensification in others.
Comments
Loading comments...
Conclusions
Preliminary key take-aways
Are EU LULUCF goals achieved, in line with the Climate Law?
- The Environmental Ambitions scenario achieves the LULUCF goal, for Full Productivity this is infeasible in current setup.
- Forests, peatlands and SOC management are key for LULUCF goals.
Is biodiversity set on a path to recovery in line with the Biodiversity Strategy?
- The Environmental Ambitions scenario achieves strong improvements across biodiversity indicators, the Full Productivityscenario less so.
How are incomes of farmers affected?
- Full Productivitydoes not negatively affect farmers income, Environmental Ambitions does with 3-4%.
What is the impact on the EU’s ability to produce enough food to ensure food security and sovereignty?
- The role of EU as a global agricultural producer is further enhanced in Full Productivity.
- In Environmental Ambitions , the EU exports less and imports more compared to Baseline but remains largely self-sufficient. The impact on food security is very small.
What is the impact of different policies on environmental and socio-economic goals and how do the policies interact?
- Policies may have positive and negative effect on climate, biodiversity or productivity goals
Comments
Loading comments...